|
Supporting Traders since 1994 |
Algorithmic Trading Tools for Professional Traders |
|
|
|
|
![]()
![]()
![]()
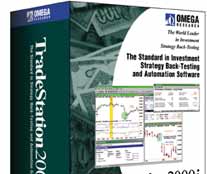
The Standard in Strategy Back-Testing and
Automation Software
TradeStation®2000i is based on the premise that emotions are your greatest obstacle to trading success. It gives you the power to rely less on emotions and more on an objective plan that you have carefully developed and evaluated historically. Of course, past performance doesn't guarantee future success. But wouldn't you like to know how a strategy would have performed in the past before putting your money on the line? Not just how much money it could have made, but how often it would have traded... what kinds of drawdowns it would have experienced and much, much more.
 | |
 |  |
Through TradeStation 2000i's easy-to-use StrategyBuilder, you'll be able to create countless trading strategies based on close to 100 built-in entry and exit signals. Or, you can create your own from scratch using EasyLanguage®, our proprietary trading language which uses everyday trading terms to describe your trading ideas. Packed with powerful analysis and charting features, TradeStation 2000i will then help you analyze your strategies from almost every conceivable angle. Plus, TradeStation 2000i includes HISTORYBANK.COM® Financial Database, which includes over 30 years of historical data that you can use to back-test your strategies to see if they could have been profitable over time. And once you're ready to hit the markets, TradeStation 2000i will actively monitor the markets for you, and alert you when it's time to make a move based on your own criteria.
Begin Feature Tour | ||||
TradeStation®2000i has the features that allow you to develop, test and automate your own trading strategies.
Develop. You'll be able to develop you own trading strategies with TradeStation 2000i's StrategyBuilder by combining dozens of pre-written entry and exit signals into various combinations. Or, create your own signals with EasyLanguage®, our proprietary trading language, and use them to further customize your strategies. TradeStation 2000i even comes with over 200 built-in indicators and studies that you can use to discover market patterns and ideas. Back-test. With TradeStation 2000i, you'll be able to back-test your strategies using HISTORYBANK.COM, an extensive database of historical market data. And, you'll be able to analyze your strategies, from almost every conceivable angle, using unique analysis and charting features. Automate. Once you're satisfied with your historical evaluation, TradeStation 2000i can automate the monitoring of your trading strategy in real-time. The QuoteMonitor will actively scan the markets for opportunities that fit your trading strategy's objectives. The Custom Alert feature will send you an alert on your computer, via e-mail or even through your alphanumeric pager, whenever a buy or sell opportunity arises based on your strategy's criteria. And, you'll be able to track your positions with the Tracking Center which will automatically update your open positions. | ||||
Feature Tour: State-of-the-Art Technology and Power | |||
TradeStation®2000i's state-of-the-art technological features give you the power to create, test and automate your own trading strategies right from your own computer. TradeStation 2000i makes use of the power and stability inherent in a 32-bit application. And, we've gone beyond that, offering you technology to capitalize on that power and take your trading strategies to a higher level...all on your home or office PC. Here's how:
Microsoft COM Architecture. TradeStation 2000i is built from the ground up with a Microsoft COM architecture that lets you open anything from an Excel spreadsheet to an Internet Browser seamlessly within any workspace. This technology actually lets you incorporate any "Active Document" in your workspaces. That includes all Microsoft applications and 3rd party applications and add-on products that you can choose to view right alongside your charts and quotes. Seamless Internet Integration. TradeStation 2000i was engineered from the ground up to make use of the Internet. Thanks to TradeStation 2000i's open architecture, you can access any Internet trading site directly from your workspace. Internet Research. Conducting Internet research in TradeStation 2000i is as easy as a click of the mouse. Simply right-clicking on a chart automatically brings up a smart browser that takes you to an Internet research site for that particular symbol, so you'll always have news and current data on the symbols you are tracking. And best of all, you can do it all from within your workspace so you won't lose sight of the symbols you're tracking. Streaming Data. TradeStation 2000i is capable of receiving streaming real-time data or downloading end-of-day data over the Internet. With real-time or end-of-day data from your Internet Data Provider the full power of TradeStation 2000i is realized. TradeStation 2000i will track this information for you, so you'll be able to take action on market moves in real-time or end-of-day. Minimal-Maintenance GlobalServer®. The GlobalServer is the heart of TradeStation 2000i, handling all aspects of your data maintenance. With it, you'll be able to collect tick-by-tick data on 50,000, 100,000 or even 200,000 symbols at once—as much data as your datafeed transmits and your hardware will allow. The GlobalServer will even add new issues for you automatically and store bid and ask. And if you prefer to filter the symbols you collect, a simple click of your mouse takes you to preloaded Data Collection Templates which allow you to choose all stocks, or all futures, or a host of other combinations. How much or how little data you choose to collect is entirely up to you, and the power of your PC. Unique Charting Capabilities. With TradeStation 2000i, you'll be able to evaluate historical bar charts containing as many as 100,000, 500,000 or 1,000,000 bars. So, your analysis power has no bounds. This is especially crucial if you're looking at extended periods of tick, 1-minute or 5-minute bars. Multiple Processor and Multi-Threaded Application Support. This feature allows you to unleash the full potential of the latest operating systems by working with up to eight CPUs on the same machine. How can this help your trading? It can insure that you get maximum power and speed, and that your computer will work more smoothly. TradeStation 2000i's processing power is what makes developing and testing your own trading strategies a reality. And, the StrategyBuilder™ is where it all begins… | |||
Feature Tour: StrategyBuilder™ | |||||
TradeStation®2000i's StrategyBuilder™ allows you to develop your own trading strategy in just a few steps. Using StrategyBuilder, you're able to combine a virtually limitless number of signals, or buy and sell orders, into a trading strategy. With its point-and-click interface, you'll be able to tap into the strategy development power of TradeStation 2000i to create your own trading strategy.
Pre-Written Signals. TradeStation 2000i comes with 97 entry and exit conditions or "signals" already pre-written for you. You can combine these pre-written signals in countless combinations to create your own strategies. Each signal is based on a widely-used technical indicator or trading concept. And if you're not quite sure how each signal works, simply clicking on the "Define" icon brings up a description for you. You'll soon feel comfortable combining more and more signals and creating a potentially limitless number of your own trading strategies to test. Custom Signals. And, your entry and exit conditions can be as simple or as complex as you desire because TradeStation 2000i allows you to customize existing signals and create new ones from scratch using EasyLanguage® . EasyLanguage is the world-standard trading language developed by TradeStation Technologies which uses everyday trading terms to describe trading ideas. With TradeStation 2000i's PowerEditor®, you'll be able to create your own signals in EasyLanguage and add them to any directory in StrategyBuilder. Then you can combine them again and again, easily and quickly, to create many different custom combinations and trading strategies to test. You may just find a strategy that works for you using the pre-written signals, but with EasyLanguage, you'll be able to write your own signals plus customize many aspects of the program to fit your specific needs… | |||||
Feature Tour: EasyLanguage® | |||
Only TradeStation®2000i gives you the ability to create your own signals, indicators and strategies using everyday language. When TradeStation Technologies first pioneered the concept of developing and back-testing custom trading strategies, we also created EasyLanguage, which lets you describe your trading ideas using everyday trading terms and English-like statements. Up until then, the ability to create computerized trading strategies belonged exclusively to software programmers and institutional money managers. With EasyLanguage, you don't need to be a computer wizard to create your own trading strategies in TradeStation 2000i.
PowerEditor. Using EasyLanguage and the PowerEditor®, you'll be able to customize many of the features of the program to fit your particular needs. You'll have the tools you'll need to create your own strategies from scratch. Or, you can use over 300 built-in functions and formulas as building blocks that you can cut, paste and combine to create your own strategies. The intelligent PowerEditor will even automatically color code your trading terms by category so you can easily distinguish the different condition. And, the PowerEditor also includes a multi-file search feature and quick reference guide to EasyLanguage words and functions. The World Standard. EasyLanguage is the world standard trading language. Many of the world's top strategy developers use TradeStation 2000i and the flexibility of EasyLanguage to create and test their own strategies. In fact, EasyLanguage is so widely recognized that trading publications even publish the exact EasyLanguage terms and statements for many of the strategies they review so that readers can try them for themselves. With the flexibility of EasyLanguage, your only limit is your imagination. Add to this the ability to test your strategies and you'll begin to see what separates TradeStation 2000i from the ordinary trading tool… | |||
Feature Tour: Strategy Testing to the Tick Level | |||||||
With TradeStation®2000i, you'll have detailed data to see right down to the tick level. Now independent traders have the ability to test trading strategies using this precision and realism. Why is this so important when developing and testing your trading strategy? Because the more precise and realistic your simulations are, the more likely it is that a historically successful strategy could prove successful in the future:
With TradeStation 2000i, you'll be able to look at every trade within a bar and know what happened. And, only TradeStation 2000i can look at the exact order of the trades that occurred during the bar. That way you can determine which entry order would have actually been filled first. Here are just two examples of Strategy Testing to the Tick Level:
| |||||||
Feature Tour: HISTORYBANK.COM® | |||
With HISTORYBANK.COM® Financial Database, you'll be able to back-test your strategies with an extensive historical market database. From stocks to futures to options, HISTORYBANK.COM contains an in-depth collection of historical data. This level of data was previously available only to institutional level traders, and they've paid thousands of dollars to access such information.
It's yours FREE. As a special limited-time offer, HISTORYBANK.COM Financial Database is included FREE on CD with your TradeStation 2000i purchase. That's a $995 value. Plus, we've also included FREE daily updates via the Internet through HISTORYBANK.COM Daily Update Service, TradeStation Technologies' Internet end-of-day financial market data service. Tailored for Strategy Back-Testing. HISTORYBANK.COM is a data source completely tailored to strategy back-testing. After all, your back-testing results are only as good as the data you use. So the data was collected and compiled with the purpose of being used by someone to make important trading decisions. No detail was spared. And, data for stocks, options and futures is specifically tailored to take into account the uniqueness of each market. Accurate and Extensive. HISTORYBANK.COM includes over 30 years of historical market data, including daily price and volume information for virtually every stock and commodity and all major indexes traded in the U.S., as well as a complete historical resource for stock splits of all kinds. Daily Update Service. And, with the Daily Update Service, you'll have up-to-date information. You'll be able to update your database daily. With a simple click of a button, you'll have updated daily prices, stock split adjustments, symbol name changes, new issues, options and futures data and much more. It's with this unique collection of historical data that TradeStation 2000i is able to help you design trading strategies. Once you've created your trading strategies and applied them to historical patterns, you can analyze them from many angles using TradeStation 2000i's Strategy Performance Report… | |||
Feature Tour: Strategy Performance Report | ||||||||
TradeStation®2000i's Strategy Performance Report includes over 200 performance fields and graphs to evaluate your strategy's characteristics. The Strategy Performance Report will help you analyze your strategy from numerous angles. This feature helps you see how your strategy could have been performed had you traded it in the past.
10 In-Depth Analysis Sections. You'll have 10 analysis sections with over 180 performance fields for you to analyze your strategy's simulated historical performance. You'll see the percent of time your strategy was in the market, as well as the exact number of days, weeks, months and years. You'll know the average time your strategy was in trades, between trades, and even the largest time between winning and losing trades. And, you'll be able to evaluate any strategy with a list of established risk-reward ratios, and see how your strategy performs from perspectives such as entry and exit efficiency and stability. TradeStation 2000i even includes a trade-by-trade report that you can sort by the factors you consider most important, whether that's total percentage of profit, total efficiency rating, run-up or a list of other criteria. State-of-the-Art Graphs. Since it's helpful to see this information in more than one format, Strategy Performance Report also includes over 20 graphs for you to highlight your strategy's key traits visually. You'll be able to evaluate your trading strategies from almost every possible angle.
Strategy Performance Report will give you a full picture of your trading strategies' simulated historical performance. And, TradeStation 2000i also includes a library of anlalysis tools to not only help you further analyze your strategies, but also to help you uncover new ideas to test… | ||||||||
| Feature Tour: Unique Analysis Tool Library | |
With TradeStation®2000i, you'll have over 200 of the most popular indicators, drawing tools and studies which can visually highlight and reveal potentially profitable chart patterns. This library of analysis tools could help be the building blocks of most of your trading strategies. Popular charting and analysis tools including Moving Averages and Stochastics are built right in, plus a multitude of others. And as comprehensive as this list is, you'll never be limited to a set of pre-defined analysis techniques, because every single indicator and analysis technique is completely customizable, thanks to the flexibility of EasyLanguage. And, you even have the ability to set alerts on your indicators and drawing tools. Just look at some of the unique analysis features you'll have at your fingertips:
These unique analysis features are designed to bring you new insights into the market that can expand, take shape and evolve into your own trading strategies, but TradeStation 2000i's analysis features don't end there…
|
Feature Tour: ActivityBar® Studies | ||||||
TradeStation®2000i brings you in-depth views of the markets. With ActivityBar Studies, you can see trading activity "inside the bar" such as the ratio of buyers vs. sellers at each point on the bar, where the greatest trading volume occurred and more. You'll have the ability to develop trading strategies based on an unique view of the markets. ActivityBar Studies are fully customizable using EasyLanguage, so you can change them to fit your needs. TradeStation 2000i includes these built-in ActivityBar Studies: Buyers vs. Sellers shows you the dominant force in the market—the proportion of buyers (bid) vs. sellers (ask) within each bar.
Candlestick Volume Accumulation looks very much like a candlestick chart, with the additional feature of showing the width of the body of the bar increasing as volume increases. Each time the volume meets or exceeds a specified amount, additional cells are added to the right of the bar. A colored line shows you if the close was above the open (hollow), or below the open (filled). Volume Distribution shows the distribution of price volume throughout the ActivityBar and the order of that activity throughout the bar. Each time the volume is greater than a specified amount, a range of cells is added to the right of the bar. In addition, each cell can be customized to show a different letter or number to signify different time intervals within the bar. Price Distribution shows you where the price action occurred in each bar to help you determine the strength of the prices of the final bar. A highlighted zone shows you the number of standard deviations above/below the row with the highest number of cells (most price action) per bar. Up vs. Down Strength shows you the strength of the Up closes and the Down closes per each specified range of ActivityData. When the volume exceeds a level you set, and the close is less than the previous close, cells are added to the left. When the close is greater than the previous close, cells are added to the right.
Volume at Price is similar to the Volume Distribution ActivityBar, except that it shows you the strength of the volume, instead of the actual distribution. Additional cells are added when the level of volume exceeds a specified amount. As the volume is exceeded further, more cells are added. You also have the ability to break up the bar into specified time intervals by customizing the cell colors. As you can see, TradeStation 2000i gives you the ability to develop, test and optimize your own trading strategies. And, TradeStation 2000i can also help you implement your strategies by identifying the particular stocks that fit your strategies' objectives… | ||||||
Feature Tour: QuoteMonitor | |
TradeStation®2000i's QuoteMonitor will help keep your finger on the pulse of the market so you'll know when opportunities arise that fit your trading strategy. TradeStation 2000i's QuoteMonitor allows you to scan, rank and sort thousands of symbols to help you quickly and easily identify market opportunities based on your strategy. QuoteMonitor offers you the flexibility to view as many quotes as you'd like in many different customizable styles, and even the ability to set alerts on an end-of-day or real-time basis. And it's easy to use--adding a new symbol simply means typing the symbol directly into any window. Apply Indicators and Set Alerts. QuoteMonitor lets you apply dozens of built-in indicators to your quote windows with a simple drag-and-drop, and set alerts on any column. Using a library of pre-written indicators, you'll be able to customize your columns to alert you to a host of possible opportunities based on the latest tick. Fully Customizable Screen. With QuoteMonitor, you'll also be able to format your screen to easily display what's most important to you. You can choose to display your quotes in fractions or decimals. Plus, you can customize your windows, and organize them in up to eight pages per window, with the ability to display hundreds of symbols in each page. And switching between windows is as easy as clicking on tabs on the bottom of your screen. You'll also be able to change the colors per cell, choose and modify the fonts to highlight specific criteria you consider most important, add or remove headings with a simple click of your mouse, and resize columns just as easily. You'll even be able to sort by any column by just double-clicking on the header. With QuoteMonitor, you'll have the tools to identify potential market opportunities based on your trading strategies. And once you're ready to act on those opportunities, TradeStation 2000i can actively monitor your open positions for you… |
| Feature Tour: Tracking Center and Custom Alerts | |||||
TradeStation®2000i will actively monitor the markets for you and automatically alert you whenever a buy or sell opportunity arises based on your own criteria. Once you've developed your trading strategies, TradeStation 2000i will monitor the markets for you, alert you to opportunities, and allow you to react quickly to make those trades. The Tracking Center will monitor hundreds of securities tick by tick and alert you when certain criteria based on your trading strategies, indicators, drawing tools, or any other study have been met.
Easy Tab Interface. With Tracking Center's easy tab interface, you'll have immediate access to all your alerts, orders and open position information. The Alerts tab will list all indicator, study and drawing tool alerts that have been triggered. The Active Orders tab will list all new market orders generated by your trading strategies that are waiting to be filled by market activity; i.e. limit or stop orders. The Open Positions tab will list all current long or short positions held by strategies currently being monitored. And once an order has been filled by market activity, TradeStation 2000i will move it from the Active Order tab to the Filled Order list. Tracking Center will even tell you when you've reached your profit target, and track your open position profit and loss for you. Customize and Filter. You'll be able to sort and color code columns to customize your display any way you like. And you can even choose to filter the information you view. So if you'd like to view only alerts for one symbol for example, you can easily customize your view to only show you information for that symbol. At any time, you'll be able to change your view to show alerts for a certain symbol, an analysis technique or any combination you choose.
Custom Alerts. TradeStation 2000i is designed to automatically alert you whenever a buy or sell opportunity arises based on your own criteria by sending a visual and audio alert on your computer. But even if you're away from your computer, you'll know when the market makes a move because TradeStation 2000i can even alert you via your alphanumeric pager or e-mail. | |||||

Copyright itservice.net 2009
| | Algorithmic Trading Tools for Professional Traders Supporting Traders since 1994 |
Copyright itservice.net 2009
| | Algorithmic Trading Tools for Professional Traders Supporting Traders since 1994 |
![]()
![]()
![]()
![]()
![]()
![]()
![]()
![]()
![]()
![]()
![]()
![]()
![]()
![]()
![]()
Copyright itservice.net 2009
|
Copyright itservice.net 2009 |